
The Power Of Simulations
Level 5 - SHARP

Do you have a friend who likes betting and would like to sharpen his/her action? Help them on their path by sharing the BowTiedBettor Substack. Win and help win!
Welcome Degen Gambler!
Today we’ll touch on an important & very interesting topic: running simulations to obtain a better understanding of the future. There’s no doubt that the ability to run & learn from simulations is a crucial tool for any bettor trying to recognize what the future may have in store for him. Without it he’ll naturally fall victim to the #1 predator in gambling, randomness.
We’ll illustrate the power of simulations by having a look at two different questions.
A UK Horse Racing gambler has recently signed up to the BowTied BetPicks Premium Service & has, during his first week, placed a total of 100 bets on different Bot recommendations. He’s been placing flat bets of £100/bet & is interested in learning what an arbitrary week/month/year may have in store for him if he keeps rollin’ at the same pace!
A Longshot Enjoyooor is placing one $10 000 longshot bet a week with the following payoff structure: There’s a 1/100 chance that he wins a million & a 1/8 chance that the bet returns $30 000. At 37.5 % EV he understands that the structure could be an opportunity of a lifetime, but he’s curious to whether his portfolio will be able to stand the variance or not. After all, he values being comfy & cool while emptying the market’s pockets.
Note: Case 2 above may sound like a very much invented problem. It’s not. IYKYK.
Why simulations?
Mathematics offer a tremendous amount of tools to understand reality. However, the closer you get to real world phenomena [which are unique, flexible & rarely adhere to standard mathematical rules], the more advanced & complex the models become.
Instead of spending countless hours on manipulating unintuitive formulas only to at best find a couple of non-precise upper/lower bounds, a better [& easier] way to approach such problems [to understand reality/a real world process] is to code up a close approximation of it & iterate through that coded version of the process a large number of times to see what happens.
Under the assumption that the coded version is a reasonable approximation of the real world process, the simulation will yield a set of alternative realities that behave very much like the one that awaits you. & by analyzing those invented realities you’ll gain the insights you need to avoid a lot of the real life confusion you’d otherwise have to deal with [rule #1: *your* intuition for randomness is beyond terrible & simply much, much worse than you think].
Note I: Of course not saying mathematics is outdated and/or useless here. As usual, the real magic lies in the combination of maths with a second subject, in this case simulations. Without math:
You don’t *really see* the assumptions underpinning the simulation results.
You can’t determine whether your simulations are properly constructed and/or whether they are any accurate at all.
Note II: Code is more flexible than pure math models. That said, it’s not as flexible as reality. The Map Is Not The Territory. Example: your amazing backtest is more likely to be a result of a bad map [poor backtesting assumptions/model] rather than a signal of a true edge.
Case 1: Horse Racing Bettor
A UK Horse Racing gambler has recently signed up to the BowTied BetPicks Premium Service & has, during his first week, placed a total of 100 bets on different Bot recommendations. He’s been placing flat bets of £100/bet & is interested in learning what an arbitrary week/month/year may have in store for him if he keeps rollin’ at the same pace!
To help our bettor understand the kind of risk he’s taking as well as what he’s to expect profit-wise we’ll utilize a combination of two clever statistical concepts, bootstrapping & simulations.
Theoretical explanation:
Bootstrapping is a statistical method that involves resampling from the original dataset to create new samples that are used to estimate statistical properties of the population. The idea is to simulate the process of randomly drawing new samples from the same population to better understand the uncertainty associated with our estimates. Bootstrapping is useful because it allows us to simulate random processes and estimate the variability of our estimates without having to make assumptions about the underlying distribution of the population.
Simulations/Monte Carlo methods are a class of computational techniques that use random sampling to estimate numerical solutions to problems that may be difficult or impossible to solve using ‘standard’ methods.
Practical explanation:
You have a dataset of 100 bets at your disposal. However, you’d like to investigate what the P&L in a sequence of 1 000 similar bets may look like. To solve this seemingly unsolvable problem you use the information provided in the dataset to generate an *artificial sequence of bets*. How? You repeatedly roll a “100 sided die”. If it comes up 64, you pick the 64th bet in your dataset & denote this ‘bet #1’. Next you throw the die a second time and in case it lands 27, you, exactly as before, pick the 27th bet in your dataset & set this to be ‘bet #2’. Then you keep rolling until you’ve built up a full series of bets that matches whatever length you wish it to have [in our case 1 000 bets]. Simple, right?
Having obtained the set of 1 000 bets, it’s time for the simulation/Monte Carlo part of the procedure. For this purpose we’ll assume [NOTE ASSUMPTION] that the closing odds equals the true probability. Is this a valid assumption? No, but it’s likely to be good enough for what we’re doing.
Each row of the dataset contains the following information: the outcome, the stake [in our case always 100 GBP], the odds & the closing odds.
Simulation recipe:
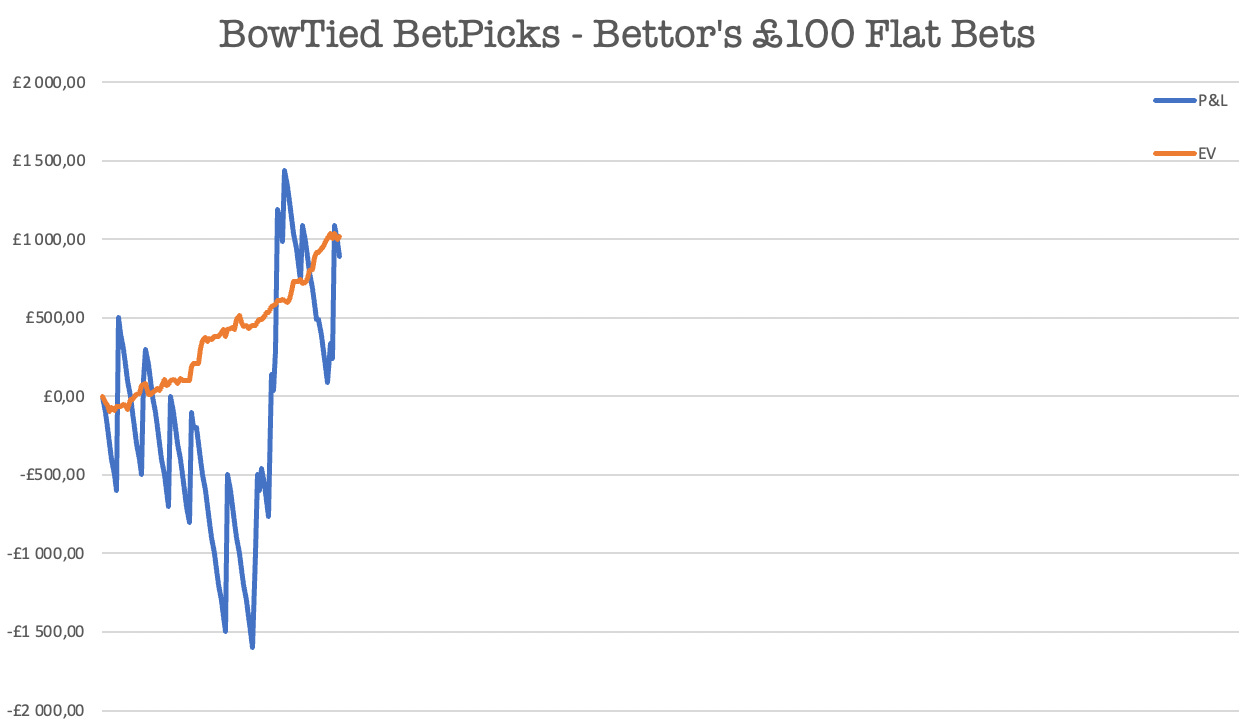
1. Visit bet #1. The closing odds is 6.40, implying a true probability of 15.6 %.
2. Generate a random number between 0 and 1.
3. If the random number falls below 0.156, consider it a 'win'. Otherwise, a 'loss'.
4. If it’s a win, add the net profits to the P&L. Else subtract the net losses.
5. Visit bet #2.
Continue until you've looped through all 1 000 bets [& make sure to track your P&L at each step of the process]... Note I: Bootstrapping methods require that the dataset/sample you’re working with [in our case the set of 100 bets] is a reasonable representation of the distribution that is generating them [both now & in the future, the ‘underlying distribution’ must stay stable]. If for some reason the Bot starts delivering completely different bets going forward and/or our 100 bet sample happens to be a huge outlier, we’ll be fooled by using the now misrepresentative dataset as a basis for our analysis. Good thing here is that there’s no particular reason to expect this pitfall to be of much relevancy for us, thus validating the use of the methodology.
Note II: The line of thinking presented here can of course be generalized far beyond betting. Stock market performance [use hourly data from the last ten High Vol days to simulate what a full month of high volatility may cause]. Crypto trading [analyze your P&L]. Sales analysis. Expected ad revenues… The list goes on. Before you begin though: understand what you’re doing. Read up on the theory & try to come up with cases where bootstrapping methods would be straight out dangerous to use [example: fat-tailed domains, rare events likely to be unseen in small samples/tail behaviour not properly captured by 50/100 data points].
To really hammer it home, here’s a step-by-step breakdown of the approach:
Assumption: We assume that the 100 bets we have are representative of the true underlying distribution that generates the bets. Essentially saying that the empirical distribution is a great approximation the true/real distribution.
Resampling: For each simulation [let's call it a run], we resample 1 000 bets from our original 100 bets with replacement [bet #64 can appear several times]. This is our sample A.
Compute P&L: For each of these 1 000-bet samples [like A], we compute the P&L.
Repeat: We repeat the resampling and P&L computation process for multiple runs [B, C, D, etc.] until we've done it enough times to get a good estimate of the mean/variance/distribution of the P&L over 1 000 bets.
Analysis: After all runs, we can analyze the distribution of P&L values from all the samples [A, B, C, etc.] to estimate the distribution of the real P&L over 1 000 bets.
Now let’s get to work. Excel file with the data for the 100 bets provided below. Python code available here.
Analysis, results & graphs
First, let’s recall the underlying assumptions of our analysis.
Betfair Closing Odds = True Probability. [Could be reduced to saying that Betfair Closing Odds is an unbiased measure (correct on average) of the True Probability, but the lighter the assumptions, the more complicated the model… & it would yield frustrating [but perhaps instructive] edge cases]
Flat Bets of £100 GBP/bet.
Future bets are well described by the 100 bets taken so far.
Since launch there has been an average of 27 bets per day. Assuming the typical subscriber is able to tail ~10 bets/day [not meant to be a full-time job, but rather an enjoyable [& profitable, ofc] experience], we consider 1 000 bets to be a natural number to begin the analysis at. This is ~3 months of using the service and if you aren’t able to run a strategy for at least 3 months without changing things, betting markets aren’t for you anyway. Consumed by Randomness.
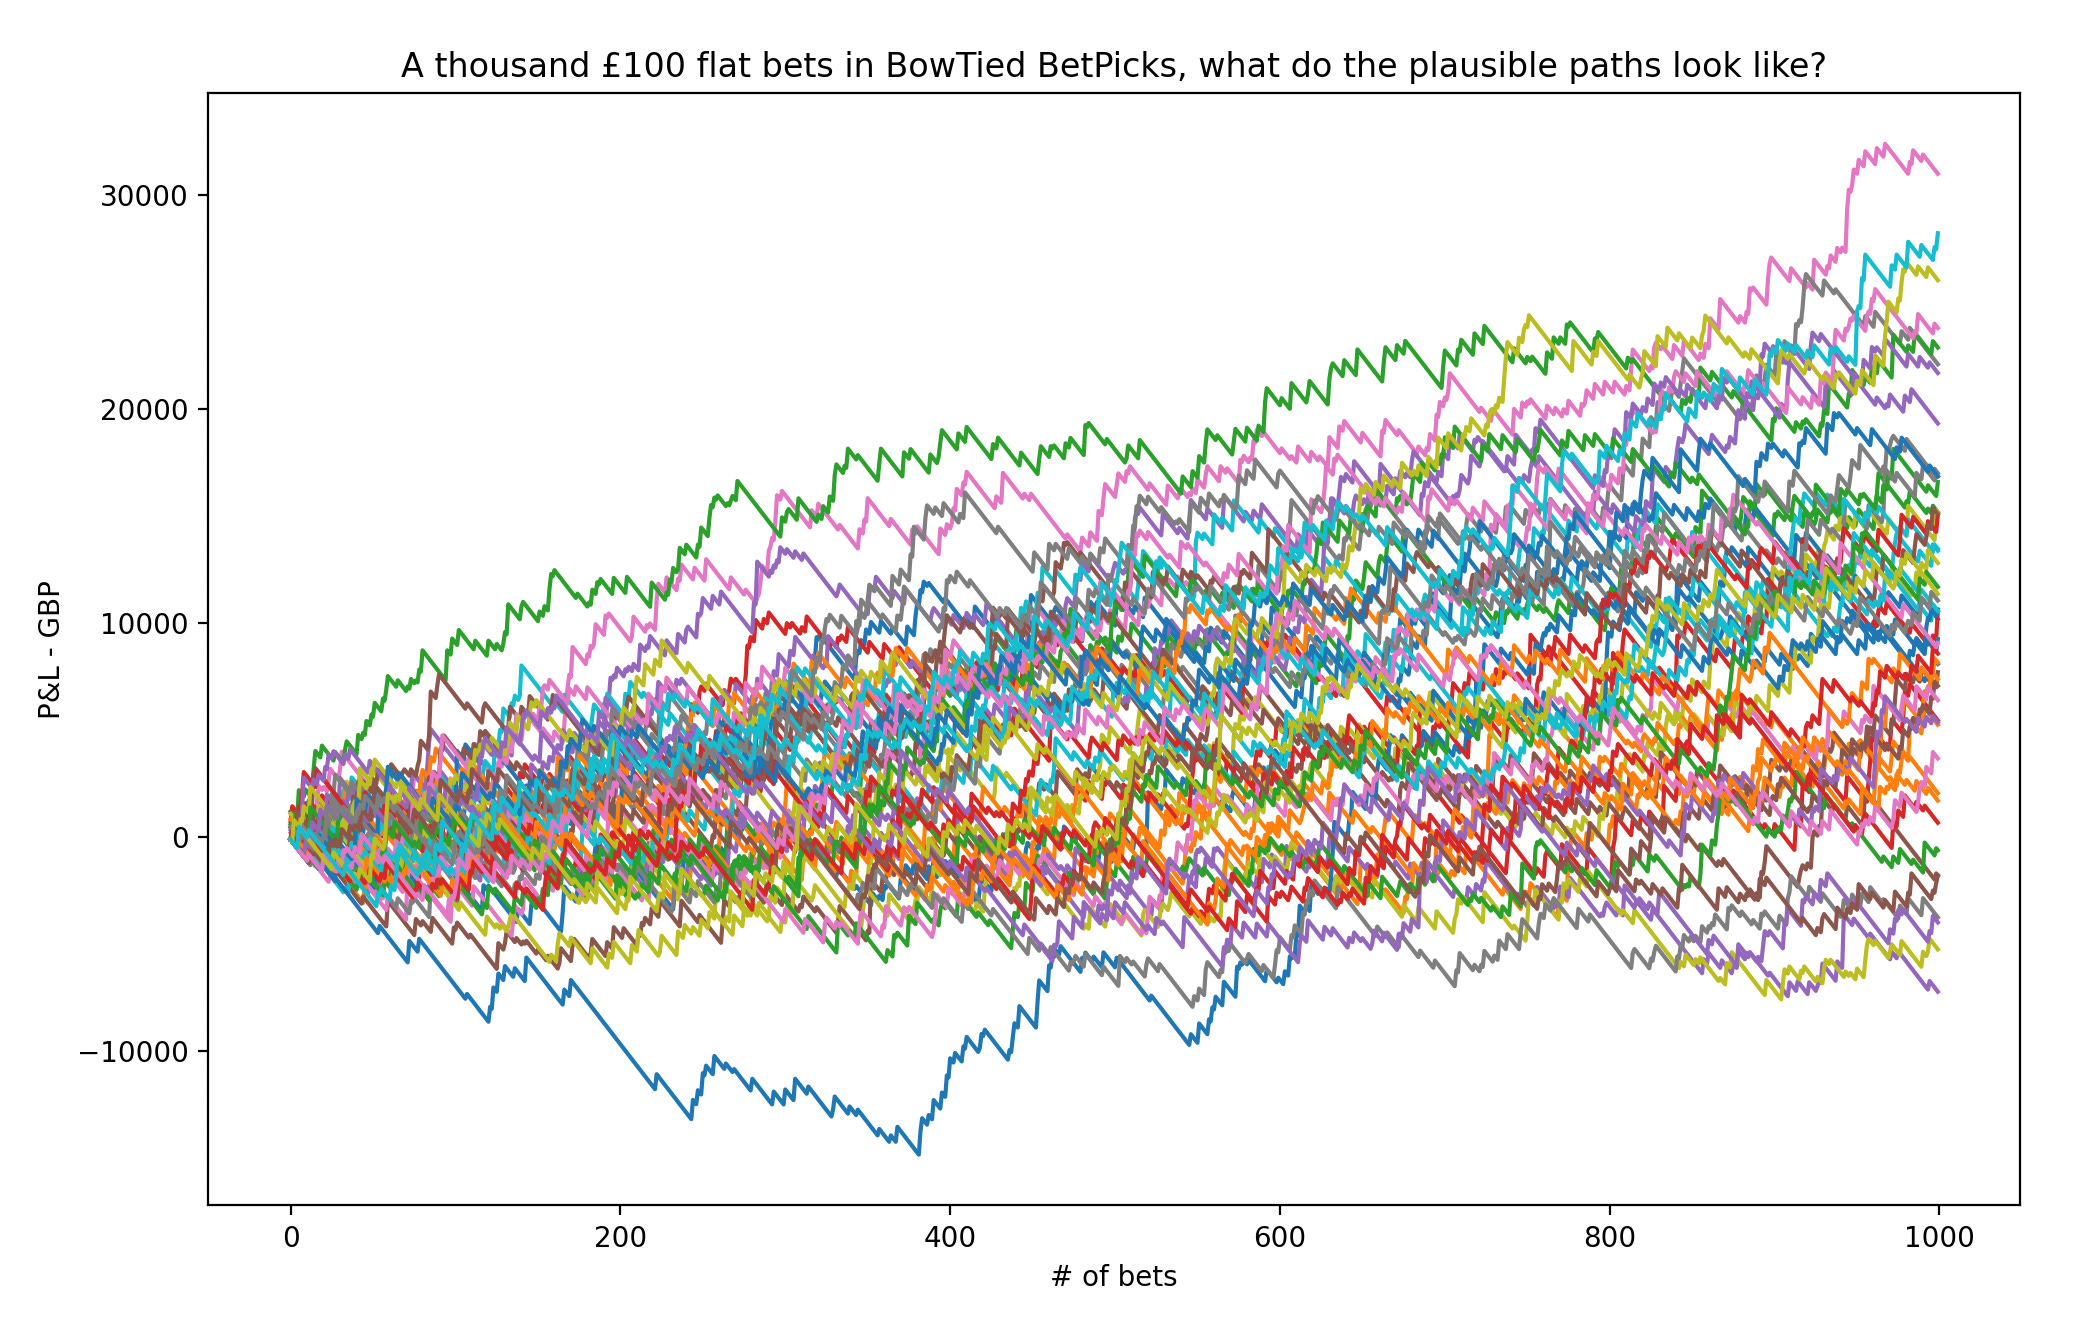
1 000 bets
Below you find an illustration of 50 different runs of 1 000 bets. You can think of it like 50 subscribers taking bets in parallel [well, not really since their performances would be heavily correlated, but you get it] until they’ve all placed a thousand bets. Throughout this time we track their performance & plot it on a bet-by-bet basis. Their final P&L’s are determined by the height of where their individual P&L graphs end.
As you can see, despite an obvious advantage over the sportsbooks [graphs trending up on average], there’s still a risk they end up losing money to them. & this is after 1 000 bets! Meanwhile Mr Average Bettor tries the service for 2 weeks & either declares you the King Of Horses or jumps the ship.
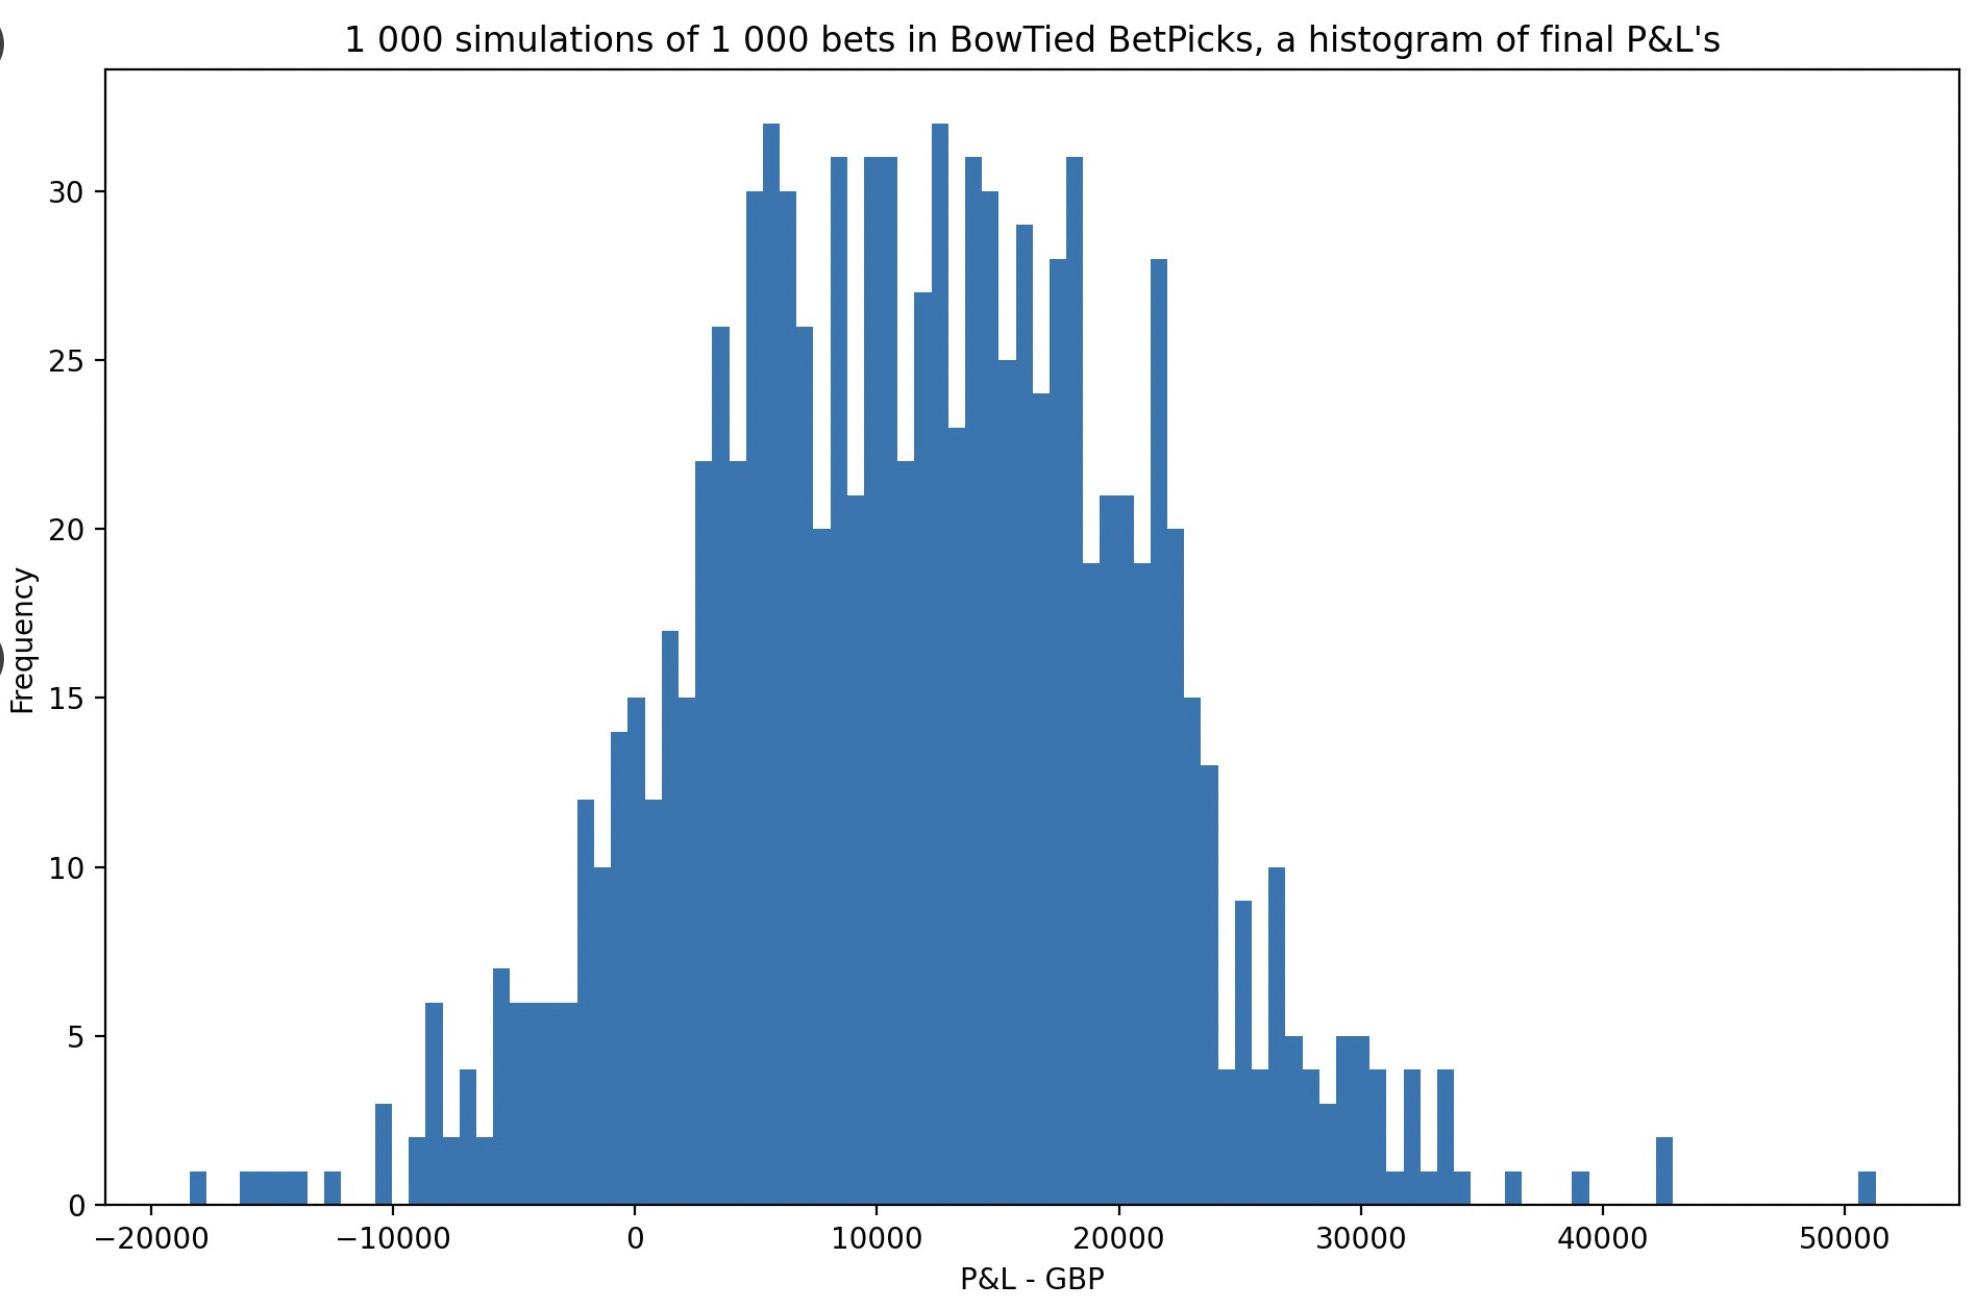
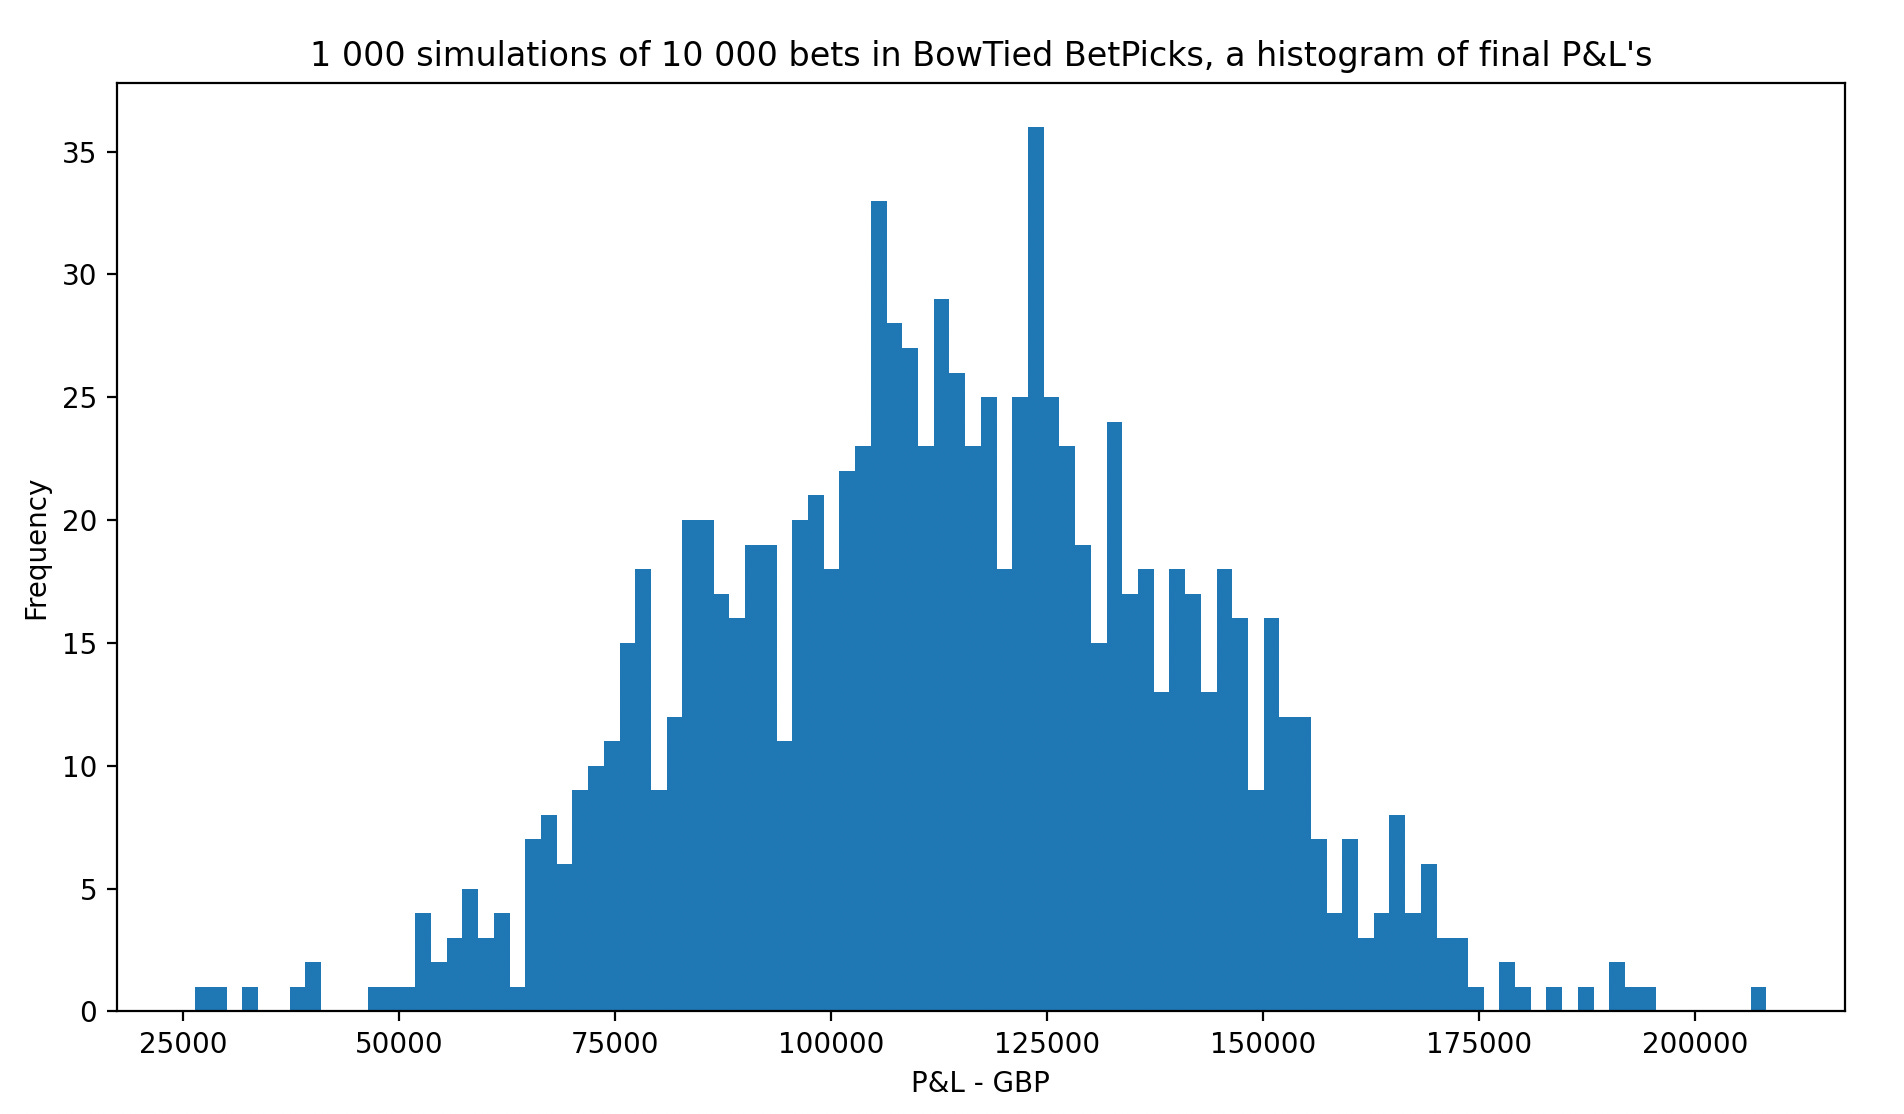
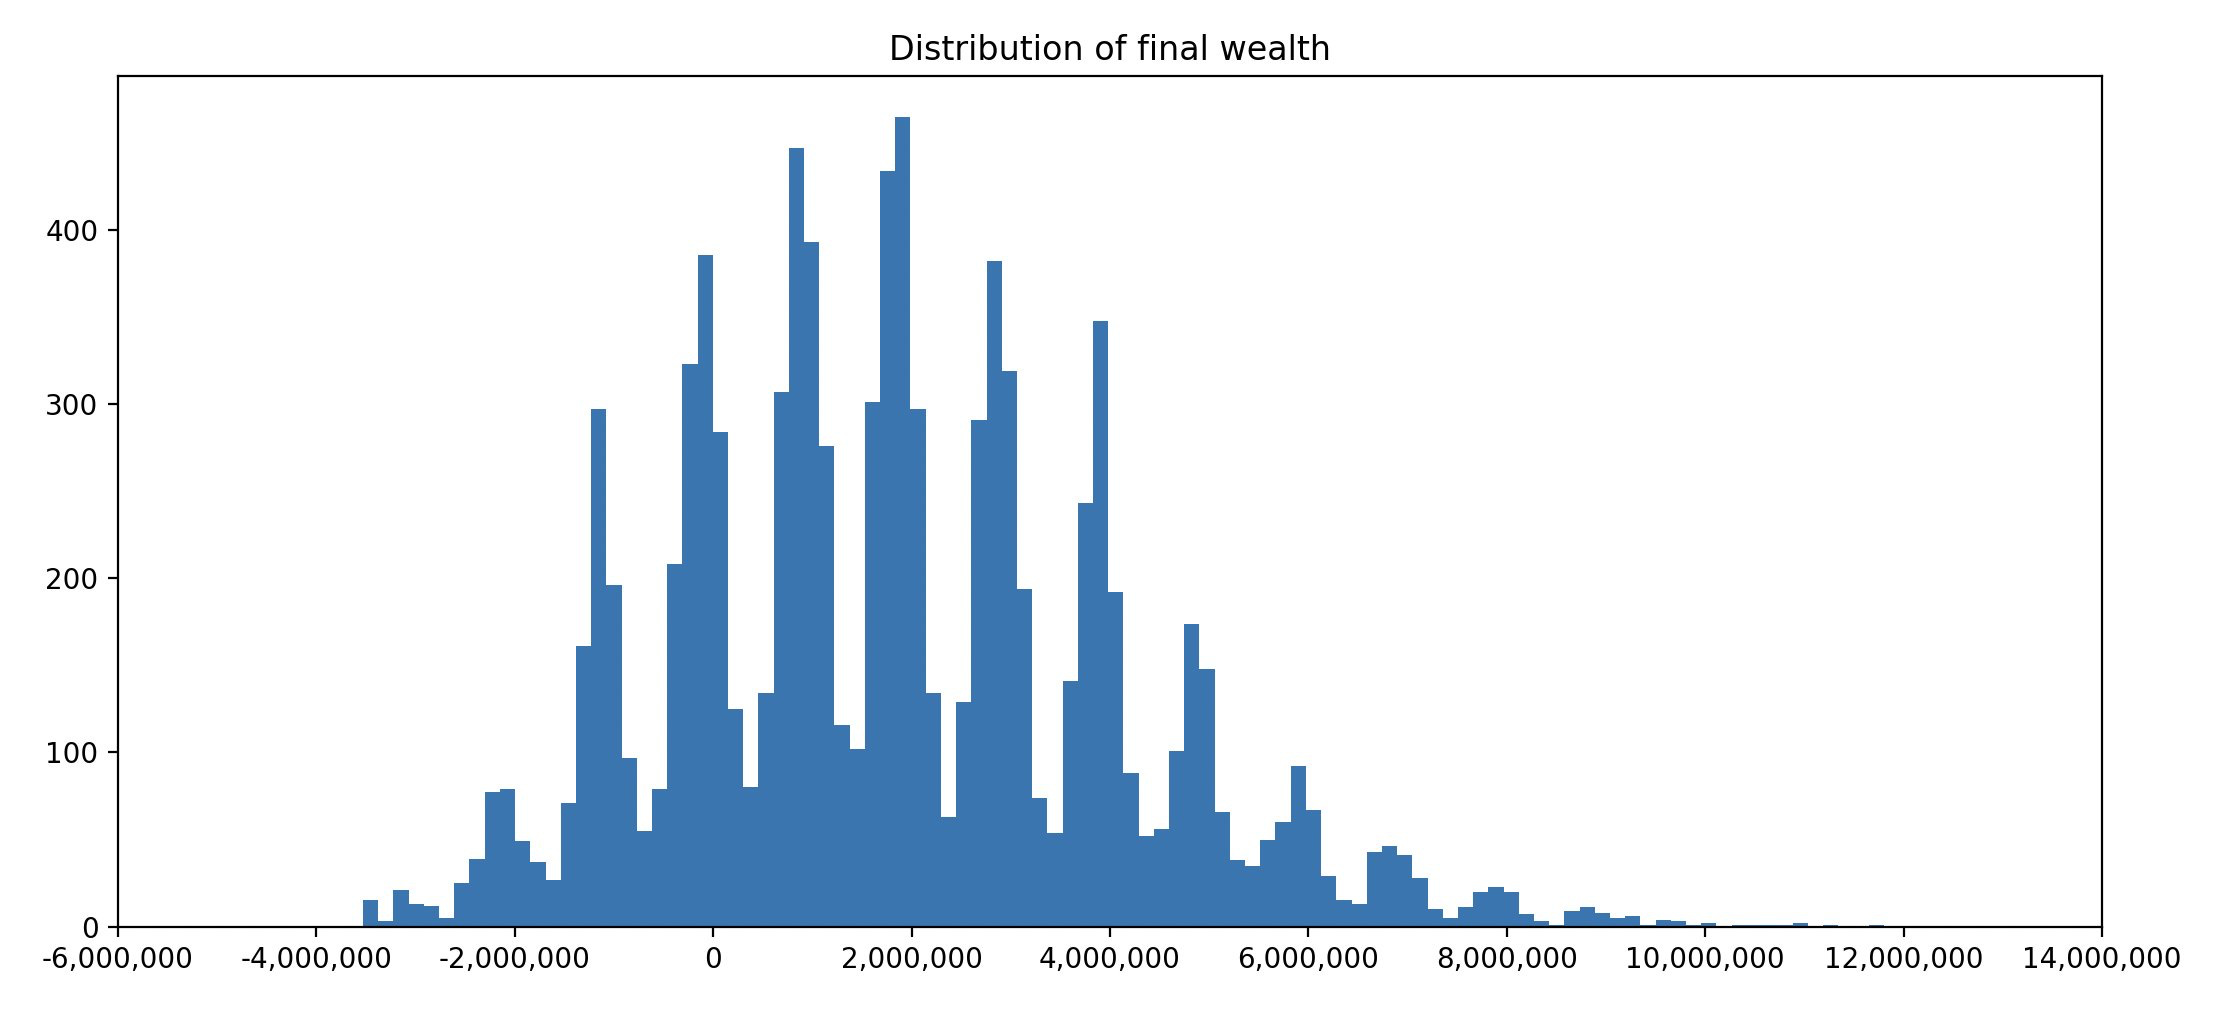
Next diagram is a histogram over final wealths for the above runs, but with the number of runs extended to 1 000 instead of 50. I.e. a distribution describing where the paths tend to end up. As you can see: very clear +EV, but with a considerable variance.
The Degen Gambler looks at the above two graphs & conclude: LFG! However, there’s this guy that doesn’t really enjoy the variance and so he comes up with an idea, what if he could hedge all the bets just before the market closes at Betfair and never take any outcome risk? And, to make things even better [or so he believes], he realises that this would allow him to increase his size heavily *while reducing the variance*. I.e. keep the same EV per staked pound, but reduce the variance. & increase the number of staked pounds. The magic formula?

Well, there’s some truth to what he’s saying, but it’s not that easy. Couple of things to consider:
Taking trades at Betfair/Smarkets/any other exchange *costs money*. You pay spread fees & commissions. Expect to lose at least 2-3 % of the value of your initial position from this alone. With an ordinary EV of 10 % that’s 20-30 % of your expected profits *erased*. However, if it lets you double your size, then it doesn’t really matter, does it? Nuanced.
Hedging things properly takes time. Contemplate the Opportunity Cost of spending 1-2 hours/day doing this.
Depending on your size, your exchange action might influence the pricing, making it a challenge for you to hedge your bets at prices you’d obtain as a low stakes bettor. Eats into your profits + won’t be long until counterparties [Cartoon Horse!?] observe that there’s yet another impatient gambler to take advantage of.
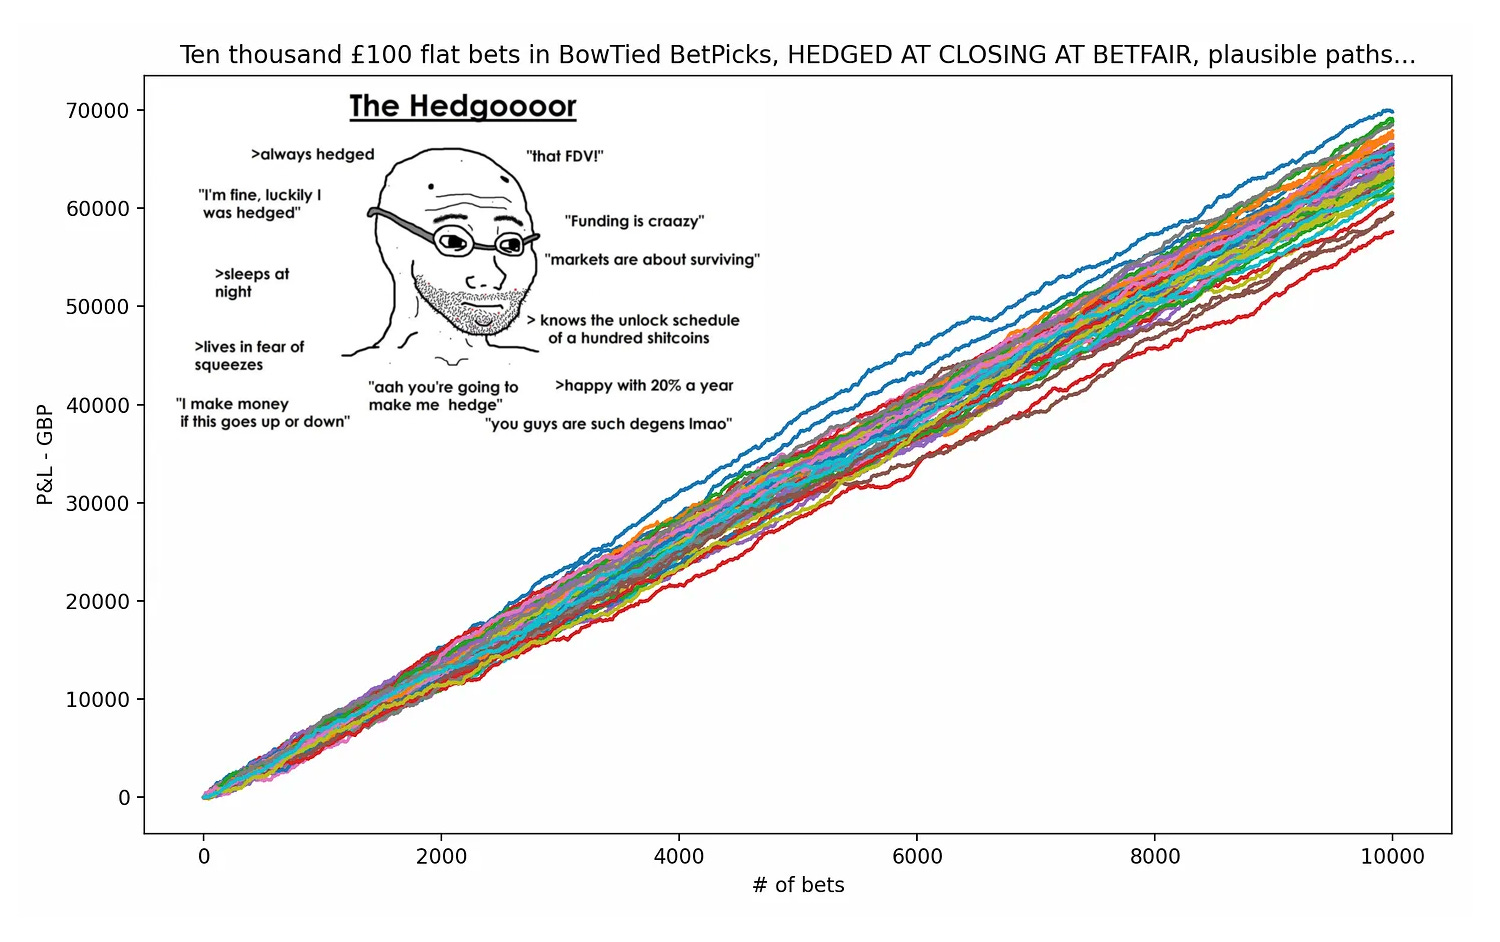
Anyway, lets simulate it. We’ll assume hedges are matched at (Closing Odds + 3 %) & commissions = 2 % [standard Betfair fee] to incorporate the thoughts in the above bullet points into our model. Results below.
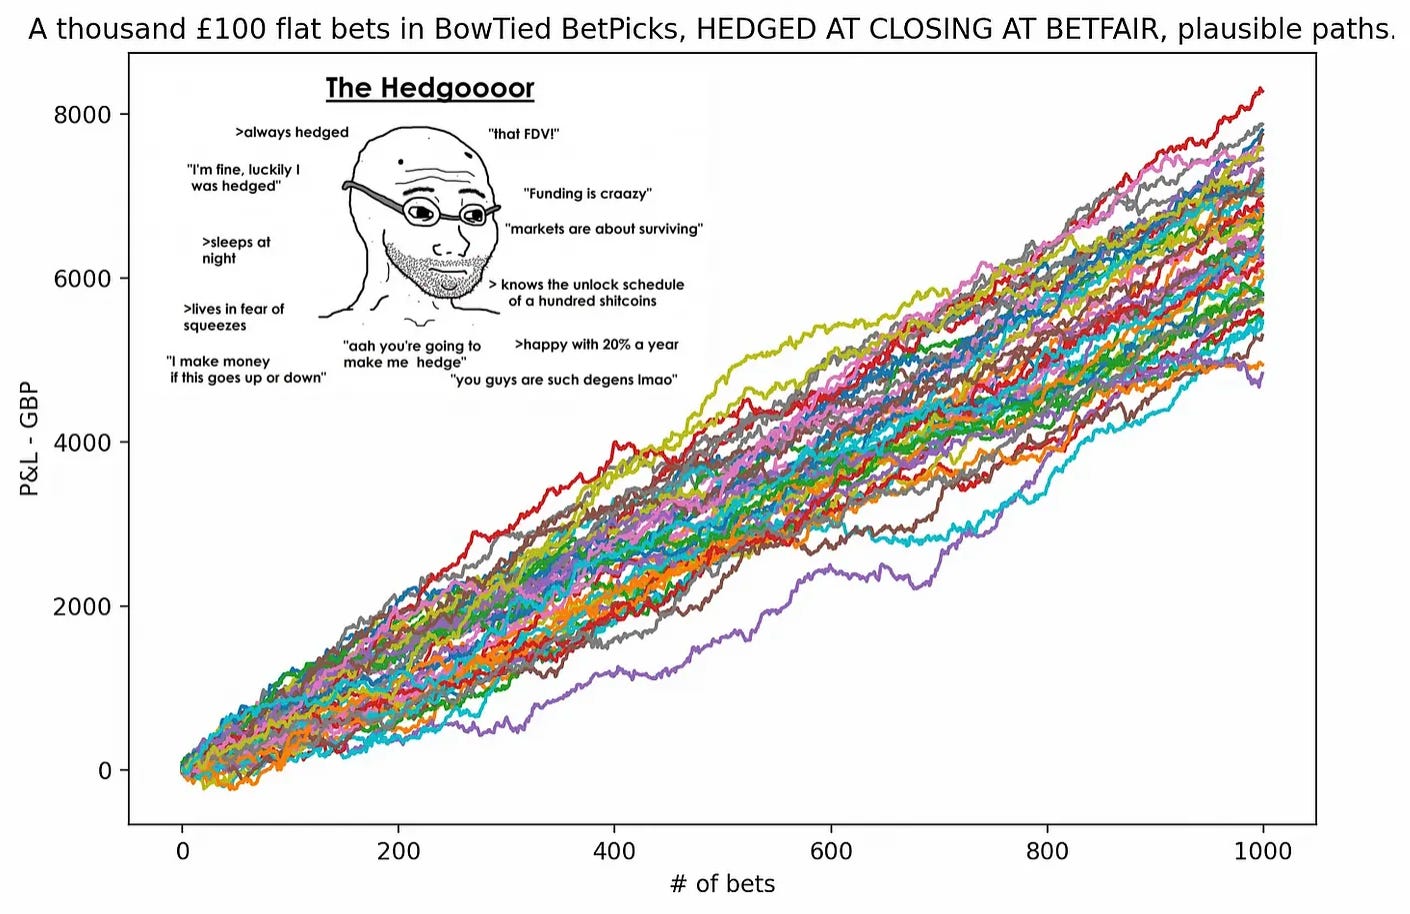
Looks good! Note that all paths go +ROI [& stay there] almost immediately.
Note: We’d recommend combining the two strategies. Sometimes you hedge, sometimes you don’t. If a 10/10 bet comes along [example, drop from 4.00 → 3.00, Unibet remains at 3.85], no reason not to hit it as hard as you possibly can [assuming it won’t get you instantly banned by the bookie] & hedge your position at Betfair. Free money.
Below we repeat the above analysis but for 10 000 bets instead of 1 000. The #1 insight: with time, the law of large numbers comes into effect & pushes more or less *all* paths into profitability.
10 000 bets
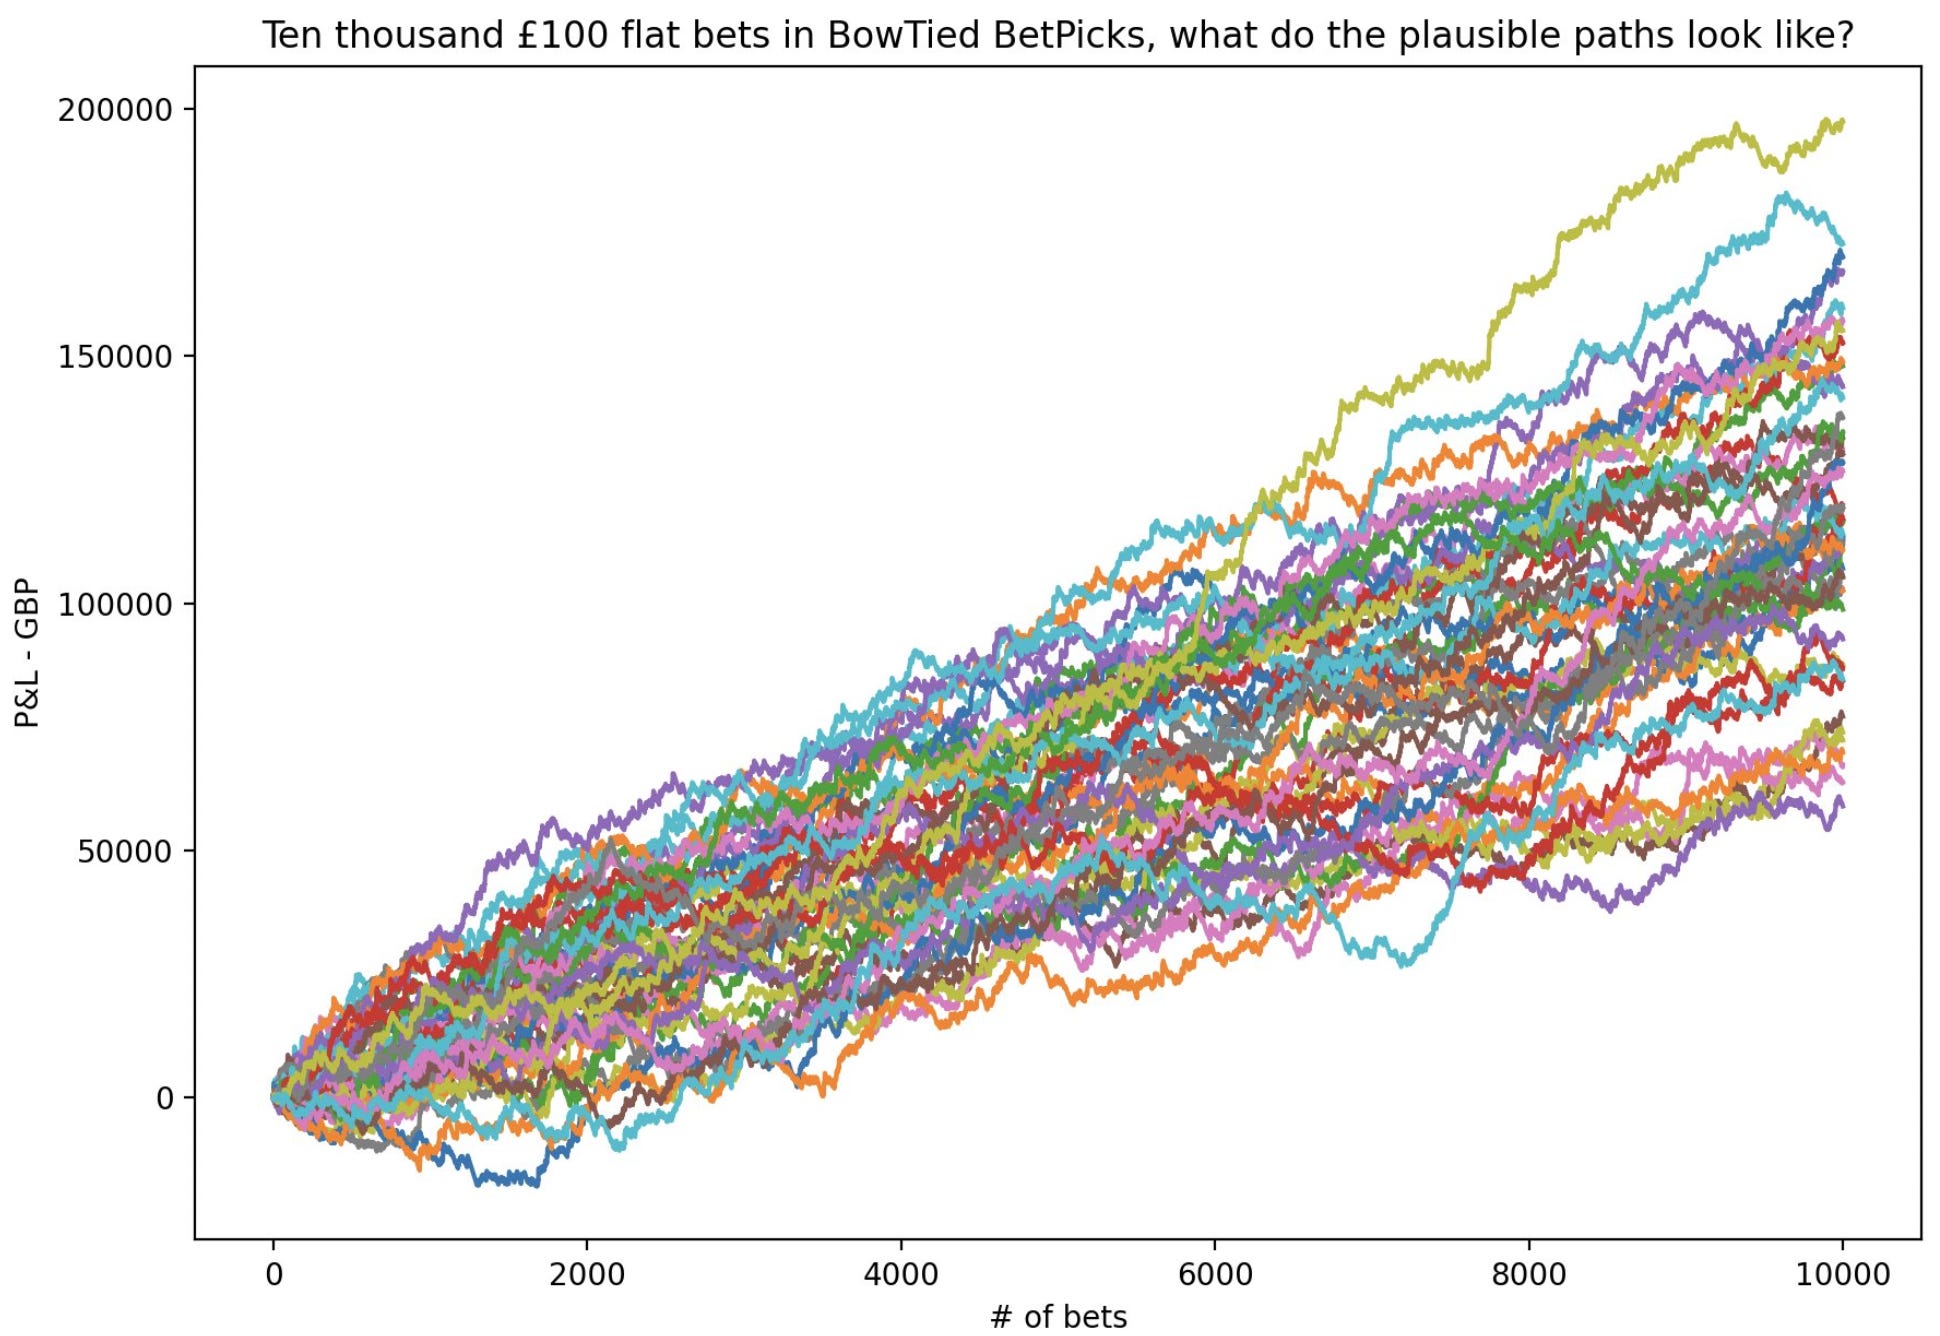
Note: As you may have understood by now: simulations are incredibly powerful. & they’re just as good for small, finite samples as they are for arbitrarily large ones. Remember, your betting career is finite. Meanwhile many mathematical results rely on asymptotic/limit theorems. The question you got to ask yourself: will I be able to run far enough to those theorems into play? If not, beware putting too much trust into them.
Case 2: Longshot Gambler
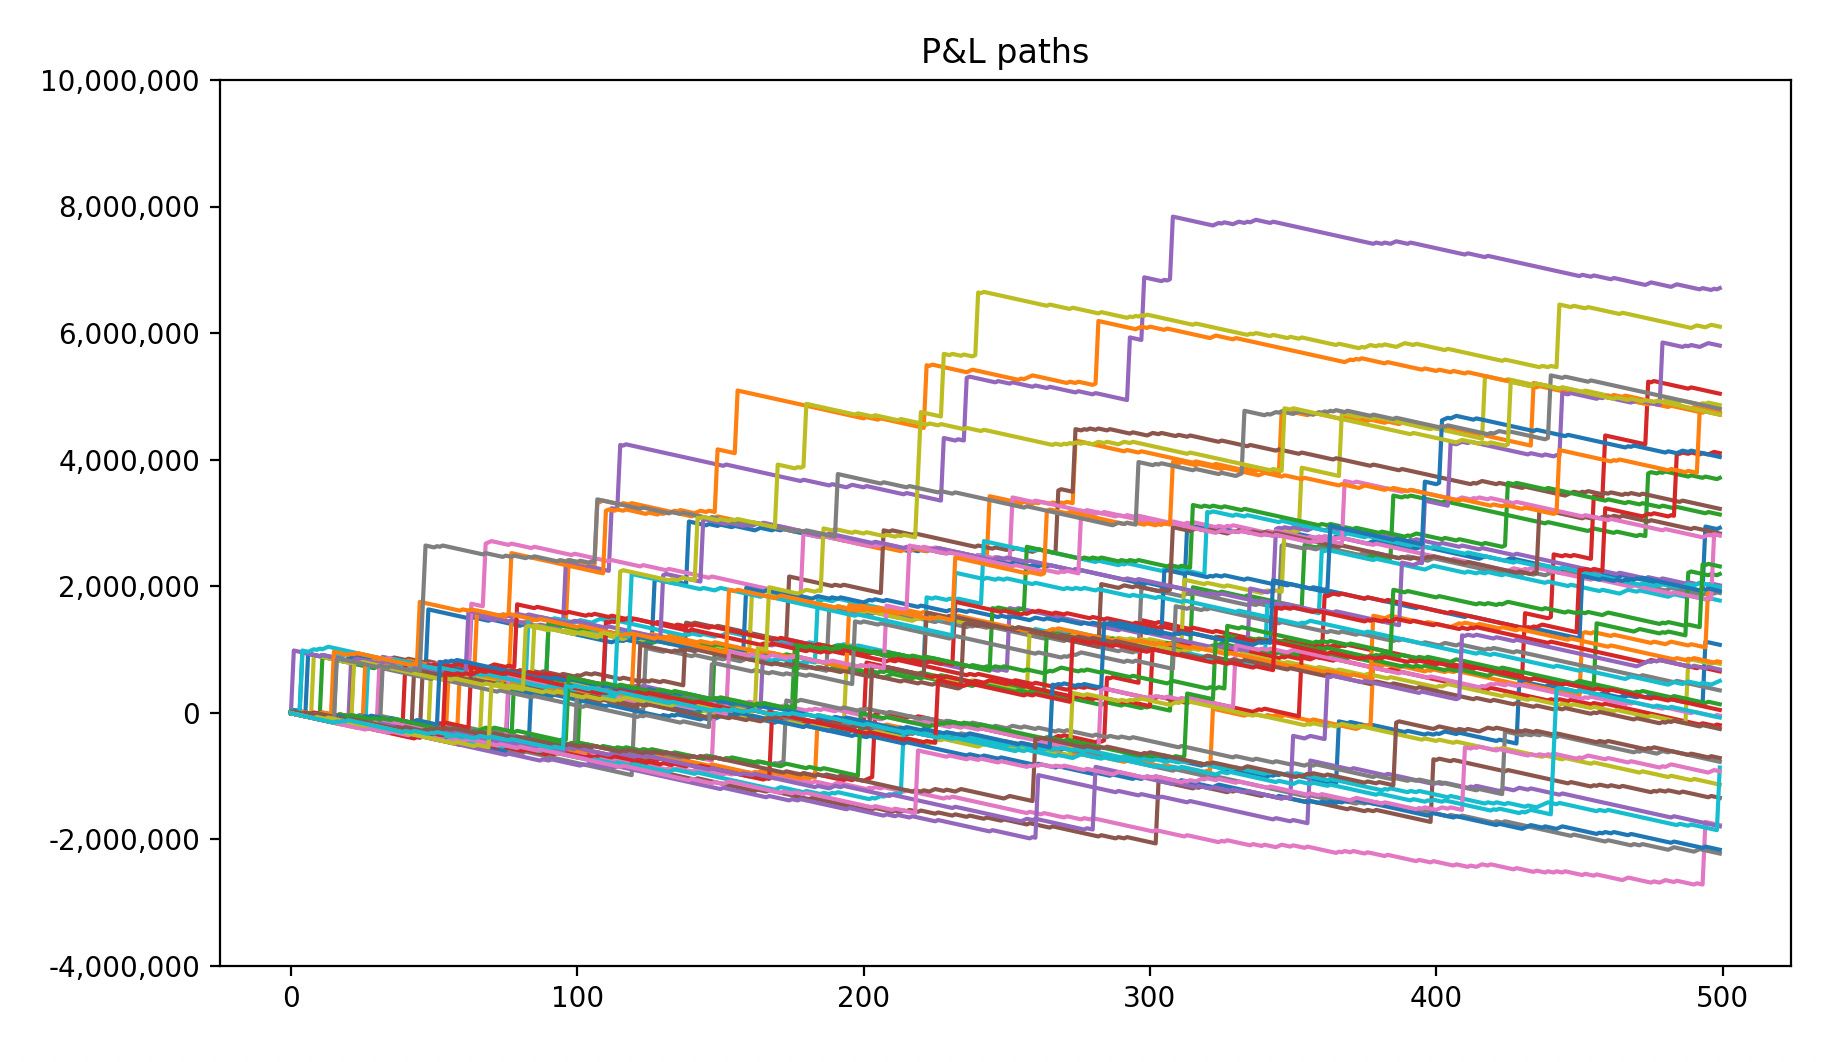
Since the first part of this post blew up we’ve decided to handle [& add in some extra twists] Case 2: The Longshot Gambler properly in a future write-up instead. Graphs shared below [for the curious reader] though. Code here.
Recall the situation: A Longshot Enjoyooor is placing one $10 000 longshot bet a week with the following payoff structure: There’s a 1/100 chance that he wins a million & a 1/8 chance that the bet returns $30 000. At 37.5 % EV he understands that the structure could be an opportunity of a lifetime, but he’s curious to whether his portfolio will be able to stand the variance or not. After all, he values being comfy & cool while emptying the market’s pockets.
Conclusion
As usual ‘near email length limit’. A few notes before we leave you for today:
Sincerely hope we’ve managed to convince you of The Power Of Simulations with this post. The frameworks presented within this treatment are strikingly effective when used correctly.
The “simple path” to success in betting markets now updated:
Do BR, continue until no more promotions.
Repeat BR on friends/family.
Transition into +EV betting [BowTied BetPicks], continue until limited/banned.
Repeat +EV betting on friends/family accounts.
The real world path for our personal BowTied BetPicks bets will unfold at https://betpicks.bowtiedbettor.com/stats-graphs. Stay toon’d & let’s pray and hope for that pink one!
BR posts coming up next on the Blog. First one on the #1 offer in the USA, a freebet packaged inside a risk-free bet. Second one on taking advantage of casino bonuses. If you have more suggestions/requests, please share them in the comments section.
Until next time…

Disclaimer: None of this is to be deemed legal or financial advice of any kind. These are *opinions* written by an anonymous group of mathematicians who moved into betting.