
The art of pricing uncertainty
Level ∞ - BILL BETTOR

Do you have a friend who likes betting and would like to sharpen his/her action? Help them on their path by sharing the BowTiedBettor Substack. Win and help win!
Welcome Avatar!
Today we’ll have a look at a concept we’ve made a lot of money from during our time in the betting markets, namely how uncertainty/variance in a horse’s performance [this thinking can be translated to *any* game/market] affects its probabilities in different markets [win, place, show, H2H etc.].
It’s a beautiful example of how the amount of uncertainty acts as one of the fundamental pieces of the pricing process.
Before we begin: a quick poll, please answer it if [and only if] you’re a frequent reader:
Have received some interesting questions lately → a new Q&A coming up soon. If you have any questions you’d like to have answered, now is the time to ask them!
A simplified model of a horse race
Our initial mission is to construct a basic model [that we’ll be able to generate probabilities from] of a horse race. This will help us prove and clarify the main results of today’s text.
Modelling a horse race isn’t the most trivial thing one can think of.
Which parameters are you going to include? What’s your assumptions regarding the dependencies between the parameters?
Note: God does probably use an infinite amount of parameters & parameter-interactions in his models. However, since we’re not gods, we must decide on a finite set of variables that approximates his outputs as well as possible.*What* are you even modelling? You’ll probably be interested in devising some function that’ll take your N parameters and map them into a response variable, but what is this response variable going to be?
The final position in the race [discrete]?
The probability of the horse winning [continuous in [0,1].
Example: generalized linear regression models [logit, probit etc.].

*The* finish time [continuous] for the horse?
A probability distribution over possible finish times?
A rescaled probability distribution over an arbitrary “index/rank variable”?

In the end, we can probably agree on the fact that you, whatever you choose, must somehow define a method to map your model outputs into probabilities. *Which path* to take towards those probabilities is far from obvious though.
Suppose you go with finish time, i.e. how long it takes for a given horse to finish the race. Will your model output be a given number or a probability distribution of ‘plausible’ times?
If it’s a number [the finish time], how do you translate this into probabilities?
[Well, you could of course say that horse A [likely the favourite] will win with certainty & enjoy staying poor.]
If it’s a probability distribution [of plausible times], how do you proceed? Do you let simulations generate the final probabilities?
You simulate a value for each horse, sort this list, let that be the result/order of the simulated race [what are the assumptions here?], and repeat this process for a large enough number of “races” [read: simulations].
As you can see, there are many tricky questions to consider and analyze if you decide to embark on the journey of trying to come up with a great & useful model for horse racing. However, since those questions/problems aren’t the main subject of today’s discussion, we’ll refrain from spending too much time trying to come up with plausible [and complex] answers to them.
Instead we’ll assume a heavily simplified but, for our purposes, informative model:
Model:
A model of finish times has been constructed, which is capable of generating a normalized probability measure/distribution for each participating horse’s finish time *with perfection*. The normalization is such that the finish time is defined as deviation from average finish time for the race [with the sign flipped to make large number = good number].
Comment: Normalizing stuff can often be a nice thing.
Horses are assumed to run independently, i.e. knowing something about horse A’s performance tells you *zero* about horse B’s.
Comment: Probably not way off for standard horse racing, however less reasonable for harness racing. The reason for the assumption: it lets us avoid having to deal with joint probability distributions [if horse A’s performance told you *anything* about horse B’s, then you’d have to take this fact into effect while running simulations, something we’d prefer to avoid].The probability distribution for the finish time of each horse is assumed to be normal.
Comment: False but the normal distribution is the only one 95 % of you have seen + there’s no cost in keeping at least some parts simple here.
When the probability distributions have been generated, the win probabilities are generated as follows: a value is simulated from each horse’s probability distribution & the horse behind the largest value is assumed to be the winner of the race. This step is repeated 10 000 times. The win probability for a given horse is then defined as the number of wins divided by 10 000.
Horse race with 5 participants
We have a race with 5 horses and want to apply the above model.
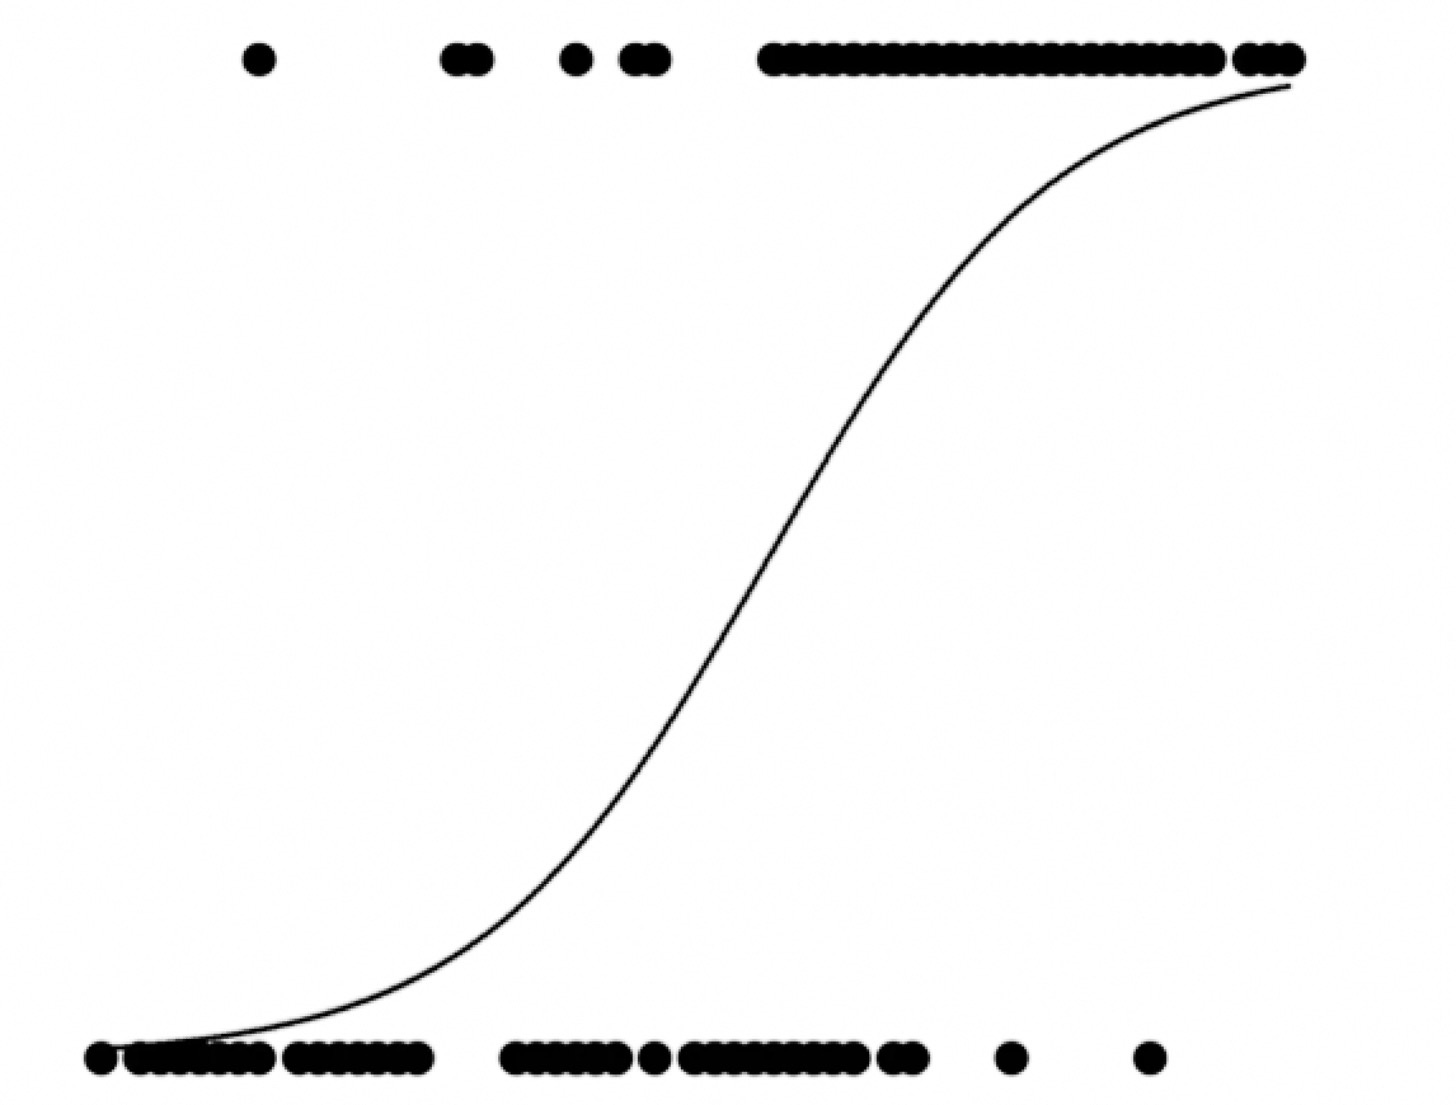
Let the probability distribution of horse A be the below [N(0,1) in case you’re interested].

Next we add in the remaining four horses, all with varying means and variances.

Now let’s run the [10 000] simulations and check what the correct odds for the different horses in the race should be!
Before we look at the result, try to answer the below three questions. Write down your answers on a piece of paper:
Which horse is most/least likely to win the race?
Which horse is most likely to finish in the top 3?
In a H2H between horse 3 [green] and horse 5 [purple], which one of them should be the favourite?
Done?
Let’s check the results!
As usual, you find the code for our examples on Github [LINK].
Simulation results
The result of the 10 000 “races”:
Horse 1 won 8 % of the races.
Horse 2 won 31 % of the races.
Horse 3 won 33 % of the races.
Horse 4 won 9 % of the races.
Horse 5 won 19 % of the races.
Conclusion: Horse 3 [green] is most likely to win the race. Horse 1 [blue] is least likely to win the race.
Thus the correct win odds are as follows:
Horse 1 - 12.50
Horse 2 - 3.23
Horse 3 - 3.13
Horse 4 - 11.11
Horse 5 - 5.26
Doing the same thing for the top 3 positions yields the following correct set of show odds:
Horse 1 - 1.60
Horse 2 - 1.57
Horse 3 - 1.81
Horse 4 - 3.45
Horse 5 - 1.12
Conclusion: Horse 5 [purple] is most likely to finish in the top 3, with a probability of ~ 89 %.
Let us now have a look at the final question of the little quiz, the H2H between horse 3 [green] and horse 5 [purple]. Recall that horse 3 was almost twice as likely to win the race.
H2H-probabilities:
Horse 3 [green] - 43 %
Horse 5 [purple] - 57 %.
Conclusion: Even though horse 3 has a significantly higher win probability, it still fails to beat horse 5 on a H2H-basis.
Indeed very interdasting results! Or, perhaps you’re not as amazed as we are?
Well, let us explain and make sense of what we’re talking about by really diving into those results now!
Before we begin our analysis, note that in reality *you never get to see* the true, underlying probability distributions of each horse, *you only know that they exist*. However, what you *do see* is the odds board for the different available markets, win, place, show, exacta, trifecta, H2H odds and so on and so forth.
A DIALOGUE: [not that we do this in practice lol, but it’s an interesting concept]:
BILL BETTOR: Assume a model. Do some magic to generate the correct probability distributions for each horse in the race. Voila, you can now produce the true odds of any possible bet that may be offered, right?
Degen Gambler: Sounds cool, but what’s this magic about and how am I supposed to find the “correct” probability distributions?
BILL BETTOR: You’re not!
Degen Gambler: What do you mean?
BILL BETTOR: Are you constantly shown odds of almost any possible bet that may be offered?
Degen Gambler: Yes, the number of different markets to bet on is just crazy.
BILL BETTOR: Good. If someone showed you his distributions, would you be able to say whether they were perfect or not?
Degen Gambler: Yes, probably, no one’s perfect though, right? And it’s definitely easier to find errors than to generate truth.
BILL BETTOR: Indeed it is. However, some do in fact claim that this guy is perfect. Perhaps they’re right.
Degen Gambler: Who? I’m confused.
BILL BETTOR: Look deeper. Someone’s showing you his distributions.

Back to the results.
Something very interesting: Purple clearly beats Green in the H2H, but Green is much more likely to actually win the race! In fact, since Purple has the *highest mean performance* of all 5 horses, no matter who we match it up against, it *must* be the favourite in the corresponding H2H [for the turbos this is obvious since normal distributions are closed under addition and Purple’s mean is the largest one in our race].
Thus, against any horse it is the most likely H2H-winner, yet it does only have a winning probability of 19 % [two participants have significantly higher win probs]!
This is because Purple always delivers approximately the same performance, while the performances of his opponents come with greater variability. Against *a single* opponent he’s the favourite, but as more and more horses [with greater variance] are added it becomes increasingly more likely that *at least one* of the remaining horses will put up a great race, which is enough for Purple to fail to win. Add in another 10 horses and Purple is *down bad*!
Uncertainty matters!In a big field, the consistent, “average” horse is without chance.
Continuing our comparison between Green and Purple we note that Purple has a much higher probability of finishing within the top 3 positions [89 % vs 55 %]. In such a small field, the consistency in Purple’s performances makes it almost certain for the horse to show. Green however is a much more complicated animal, either he puts up an excellent race and wins, or he’s simply not having it and finishes at the back of the field. And this is not a good thing for the place & show markets! Conclusion: the relationship between the win, place and show markets are severely different for the two participants.

When betting the win markets, fall in love with horses with extreme variability in their performances.
When betting the remaining markets, beware uncertainty.
Finally: here’s the main point of this post. Win markets are easy objects. It’s the one thing everyone spends their time on.
Where is the intuition, the beauty, the fun in 1 200 trifecta permutations? Right, there is none! In win markets all you need is to find the best horse! What a beautiful game. 10 horses racing side by side, fighting to cross the finish line first. Of course you love it.
And indeed you’re not alone.
So everyone invests a lot of time and resources into this part of the game. And soon they for sure become pretty good at finding the winner. In some cases, even extremely good.
BUT WHAT DO THEY DO NEXT?They notice the rest of the markets. And having obtained great estimates of the win probabilities, they of course do the obvious thing.
They simply map their win probabilities into place, show, H2H, exacta, trifecta and even more complex probabilities.& they spend tremendous amounts of time looking for the “perfect link” [the holy grail] between the win probability and the remaining probabilities. [Go ahead and Google “Harville Formula” [psyop] & all its variations]
& bookies even include those maps in their algos [think long & deep here ser].
And somehow [what a surprise] those maps have a tendency to map favourites into favourites, and underdogs into underdogs, *across all markets*.
Which our dumb little model of normal distributions has just shown can be so incredibly wrong!
Remember:
It’s easier to find errors than to generate truth.
If you bet multiple [connected] markets, *always* separate them out when analyzing your P&L.
Completely random fact but whatever: when you read something online on betting, always assume it’s psyop. Especially when it comes to betting software. “Why am I offered *this* set of functions? What am I *not* offered?” should be your first questions.
That’s all for today.
Next time there’ll be less autism.
Until then…

Disclaimer: None of this is to be deemed legal or financial advice of any kind. These are *opinions* written by an anonymous group of mathematicians who moved into betting.
Awesome post!
I confess to never having thought deeply enough about the differences between outright winner and places but this spells them out nicely. Very interesting.
Something I’m not able to grasp. How is an invented modell of 5 horses time performance extrapolated to reality and concrete races, where there can be much more horses, different race distances etc…
Thank you and best regards!